COURSE 8 – CHART TYPES
Bar Chart
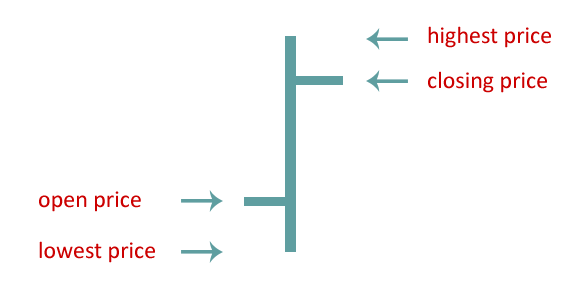
Bar chart is a type of chart looks like a bar. The top of the bar represents the high of a given period. The bottom of the bar indicates the low of the given period. The closing price is at the right side of the bar, and the open price is at the left side of the bar. The bar chart is the most popular chart type.
Candlestick Chart
Candlestick charts were originally invented by Japanese rice traders in the 17th century. Candlesticks are usually composed of the body, upper shadow and lower shadow.