COURSE 7 – ADVANCED
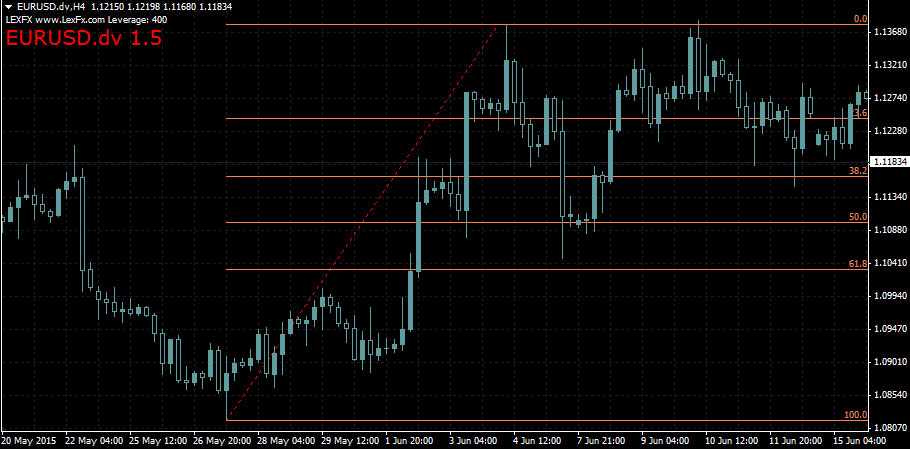
Fibonacci Retracement
The Fibonacci retracements is the most useful in the trending market.
The Fibonacci theory is named after a prominent Italian mathematician of the late twelfth and early thirteenth centuries. The theory provides ratios, which play important role in the forecasting of market movements. Fibonacci introduced an additive numerical series that has come to be called the Fibonacci sequence, which consists of following series of numbers: 1, 2, 3, 5, 8, 13, 21, 34, 55, etc.
How To Use Fibonacci Retracement
Fibonacci retracements use horizontal lines to indicate areas of support or resistance at the key Fibonacci levels before it continues in the original direction. These levels are created by drawing a trendline between two extreme points and then dividing the vertical distance by the key Fibonacci ratios of 23.6%, 38.2%, 50%, 61.8% and 100%. A trader usually looks at retracement of 38.2% of the initial move. If it holds, the original trend will continue. A retracement to 61.8% implies that a new trend is establishing itself.
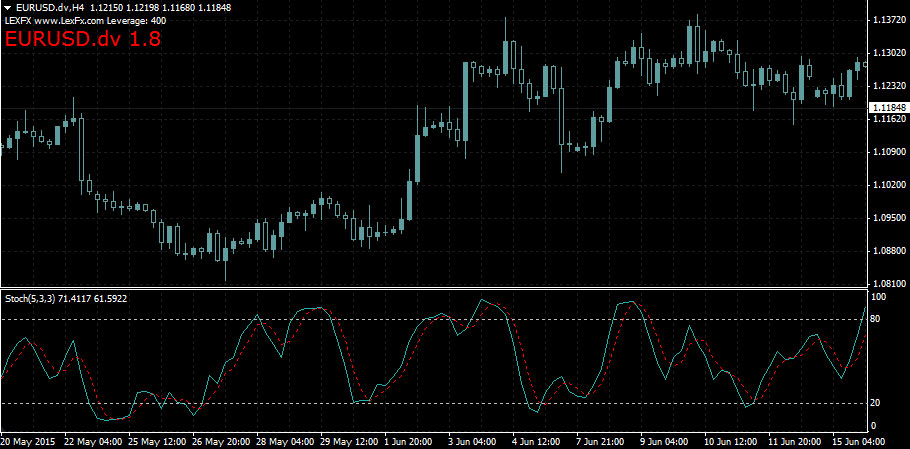
Stochastic Oscillator
Stochastic oscillator is a very useful momentum indicator that compares the instrument’s closing price to its price range in any given period. The sensitivity can be adjusted by changing the time period. or taking a moving average.
%K = (Current Close – Lowest Low) / (Highest High – Lowest Low) x 100
%D = 3-day Simple Moving Average of %K
How To Interpret Stochastic Oscillator
Traditional settings use 80 as the overbought threshold and 20 as the oversold threshold.
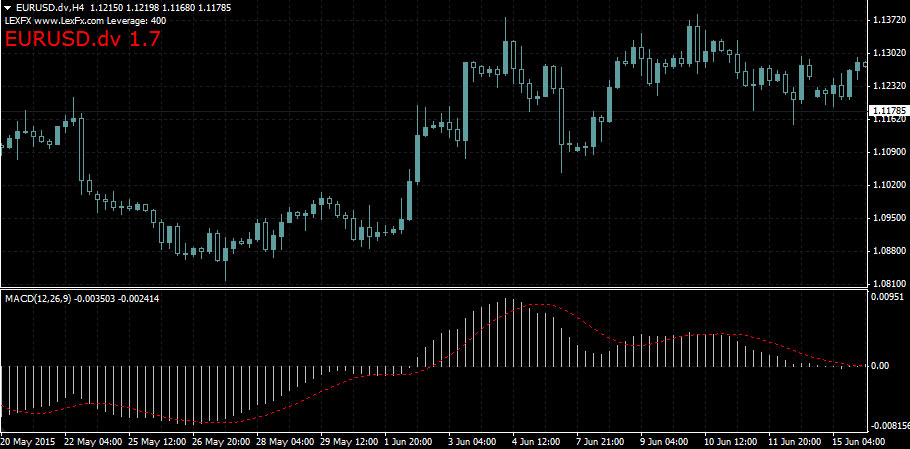
Moving Average Convergence Divergence (MACD)
MACD stands for Moving Average Convergence / Divergence. It is a trend-following momentum indicator that shows links between two moving averages. The MACD is calculated by subtracting the 26-day exponential moving average from the 12-day exponential moving average. The signal line is the 9-day exponential moving average or EMA.
How To Read MACD
Crossover – When MACD falls below the signal line, it indicates a bearish market. It maybe the time to sell or go short. Vice versa, if MACD line moves above the signal line, it shows a bullish trend. It may create an opportunity to sell.
Divergence – When the price diverges from the MACD, it signals the end of the trend.
Drastic pull – When the MACD rises drastically, shorter moving average moves away from the longer-term moving average, it signals the instrument is overbought.